Japanese Equities in the Wake of Interest Rate Changes
Surge of volatility triggered by the Bank of Japan's decision to raise rates
Japanese equities began the year with steady gains, driven by strong earnings and optimism around wage increases. After surpassing its 1989 peak in late February, the market experienced a decline by the end of July 2024, shortly followed by the biggest single-day retreat in early August, highlighting the market's volatile nature.
The surge of volatility was primarily triggered by the Bank of Japan's (BoJ) decision to raise rates to 0.25% at the end of July. Global market turbulence fueled by concerns over the US economy also compounded the situation.
Reasons behind the interest rate increase
The decision to raise the interest rates was made due to the relatively strong foundation of the Japanese economy, citing gradual price increases alongside wage growth, despite concerns about the impact of rising prices on consumer spending, as stated by the Bank of Japan Governor, Kazuo Ueda. For nearly a decade, Japan’s central bank has maintained interest rates near or below zero, aiming to encourage inflation in an economy that has historically battled deflation. However, when wages did not keep up with rising prices, consumers tended to reduce spending, leading to inflation levels surpassing the BoJ’s target of approximately 2%. Despite some areas of weakness, Japan's economy remains on a path of moderate recovery following recent changes in interest rates. Private consumption has continued to rise, supported by stronger corporate profits and increased business spending. However, exports and industrial production have remained largely stagnant.
Impact on Equity Performance and Volatility
The decline in Japanese equities coincided with the reversal of the carry trade due to the interest rate hike, suggesting that the market sell-off was primarily influenced by capital flows rather than fundamentals. BoJ has signaled further rate hikes in the future, which would reduce the interest rate disparity between the U.S. and Japan, leading to diminished investor optimism and propelling market volatility. During the first three days of August, driven by economic fundamentals like weaker-than-expected U.S. job reports and shifts in Japanese interest rates, the market plunged over 20%. However, just as panic started to take hold, the stock market made a dramatic recovery, climbing to its largest single-day recovery.
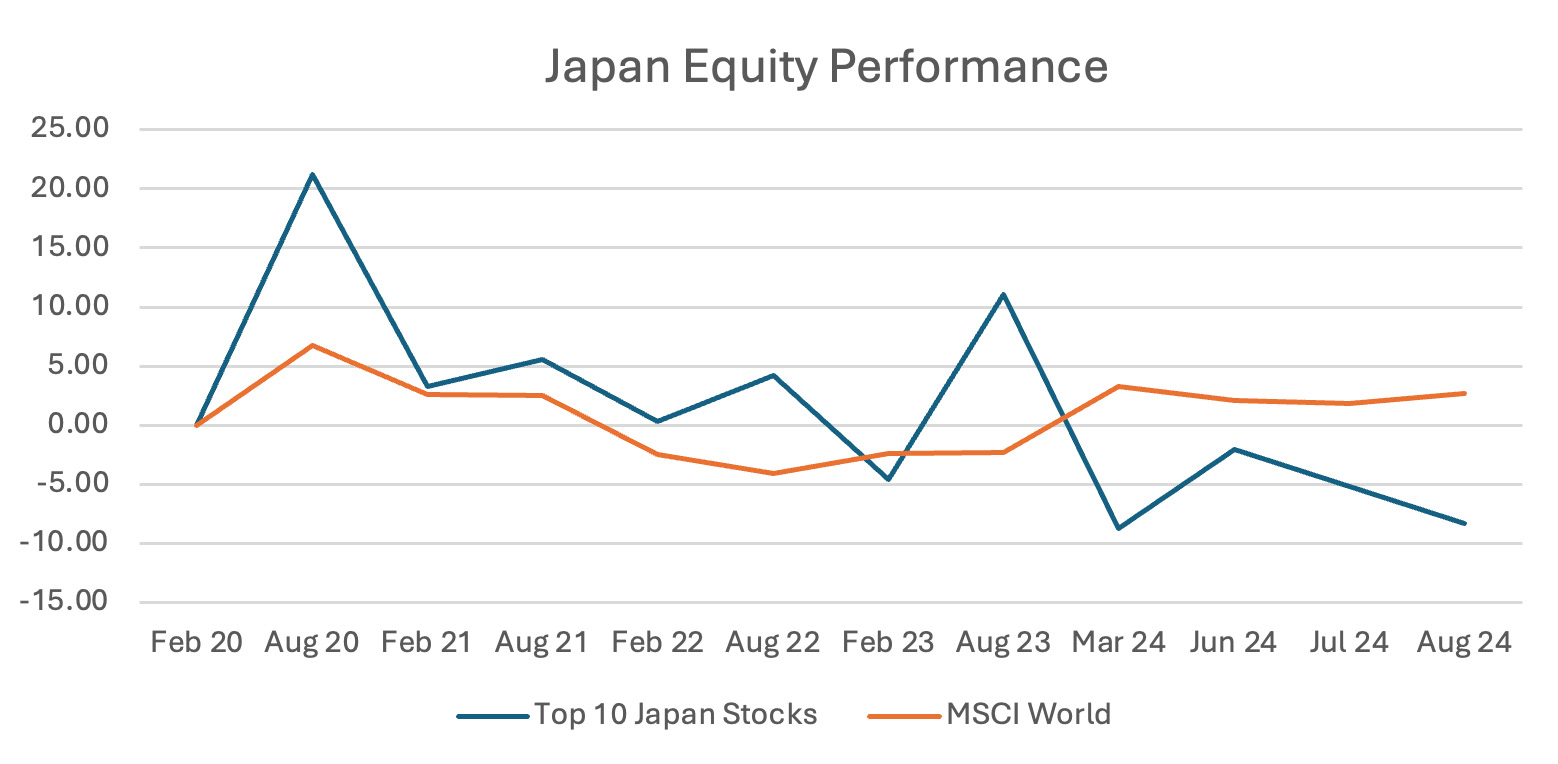
Source: Confluence Style Analytics
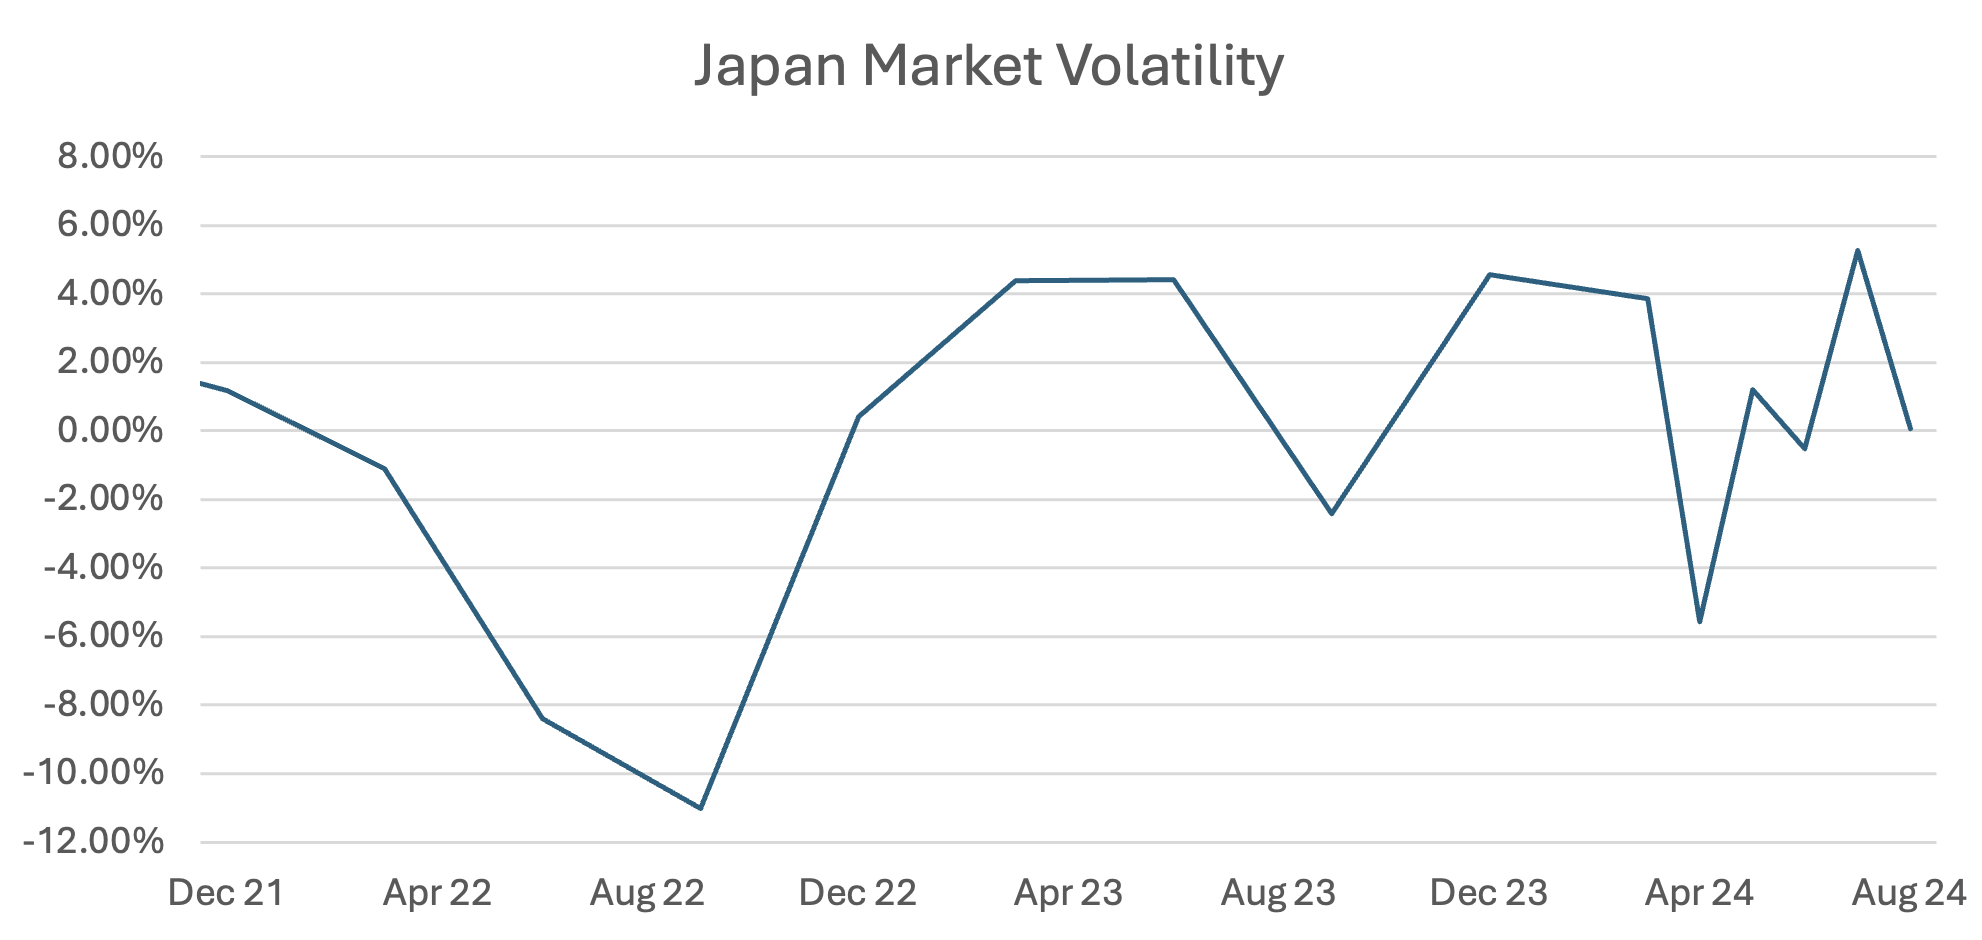
Source: Confluence Style Analytics
Exporters have gained the most from a weak yen and would be most affected by a turnaround. For this reason, Japanese companies that engage in exports or have global operations can also be tailwinds generated by interest rates and currency fluctuations. Regional, small financial companies are also likely to benefit from a stronger yen, while larger banks with more foreign exposure will adversely impact it.
Sector Composition and Performance
Japan's stock market has a well-diversified sector composition. Unlike the U.S. market, which is dominated by a few tech giants, or Taiwan, where semiconductors lead, Japan offers exposure to a wide range of industries and has low correlations with other asset classes.
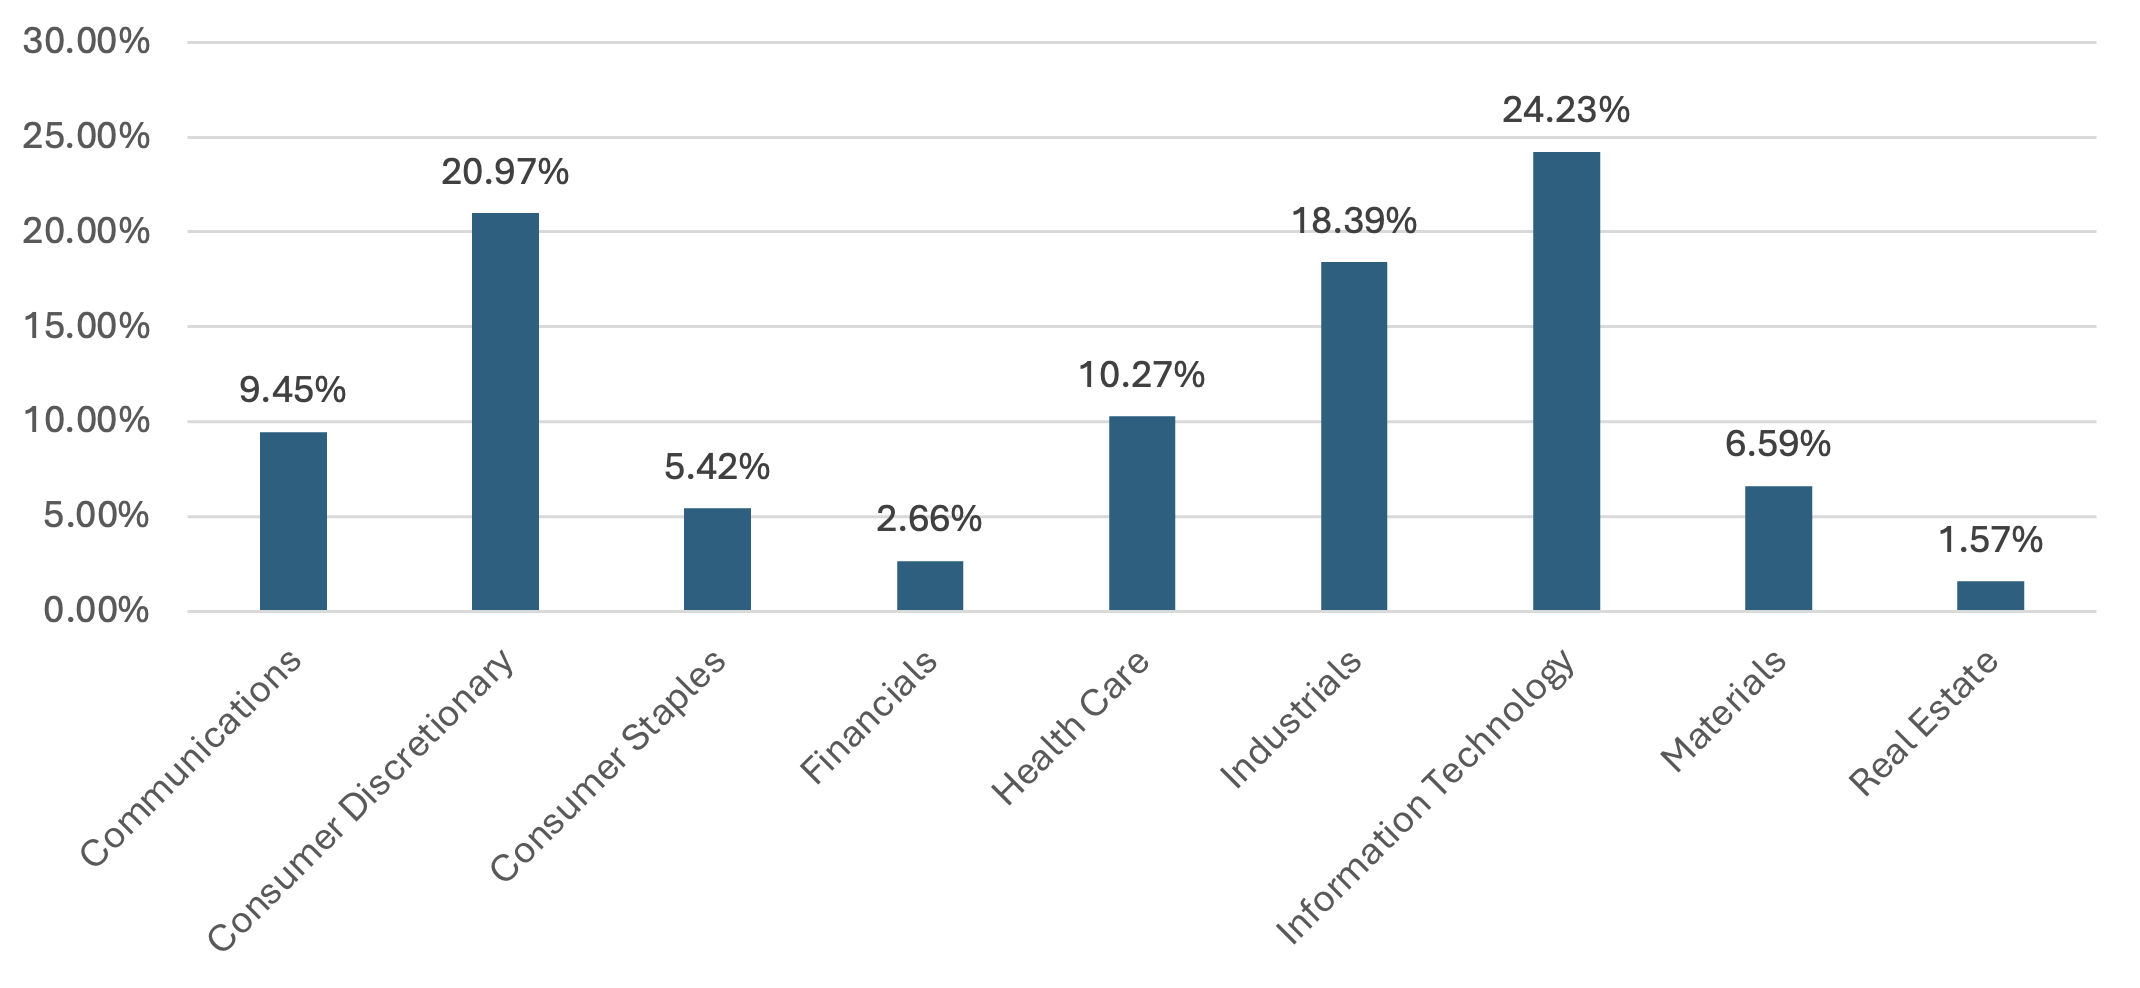
Source: Nikkei Index
As shown in the chart, Industrials, Consumer Discretionary, and Information Technology dominate the index, accounting for approximately 64% of the total index. A closer look at the valuation performance of these sectors reveals further insights.
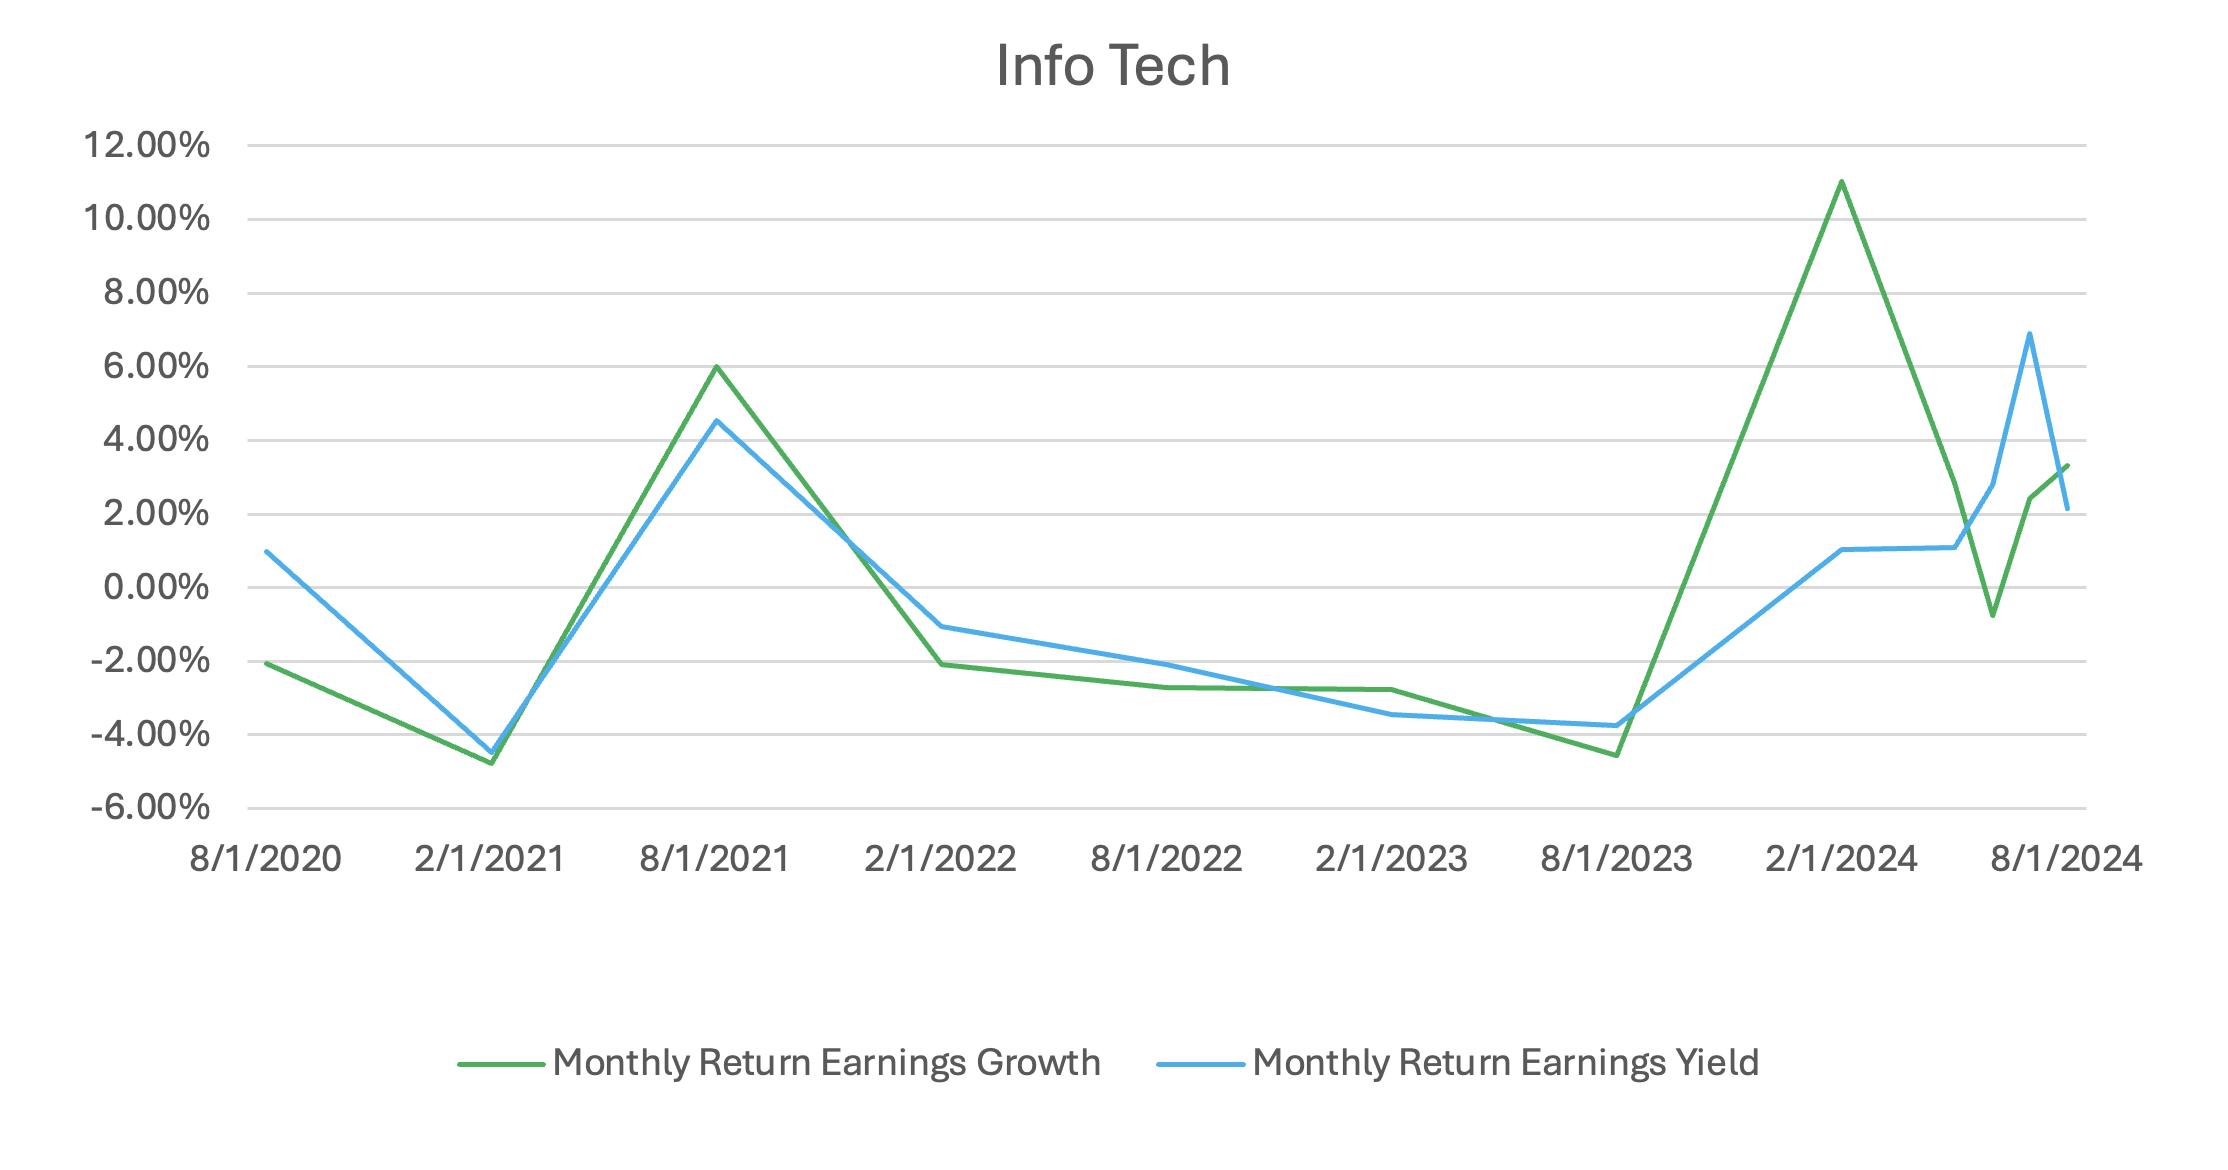
Source: Confluence Style Analytics
The performance gap between high earnings growth stocks and companies with stable earnings yield widened significantly at the start of this year, marking the first time this occurred since COVID. Early in the year, the market favored high earnings growth over earnings yield within the sector. However, this trend began to reverse around June, and the market has been adjusting since the global equity market shock in July. Japan boasts a significant information technology sector. In 2020, the software industry alone recorded sales of nearly 16.7 trillion yen. Although the global tech sector, lately, has primarily been driven by the United States, Japan’s tech ecosystem, which dominated the industry during the 1980s and 1990s, is now sparking renewed interest with optimism rising around semiconductors and communications.
Source: Confluence Style Analytics
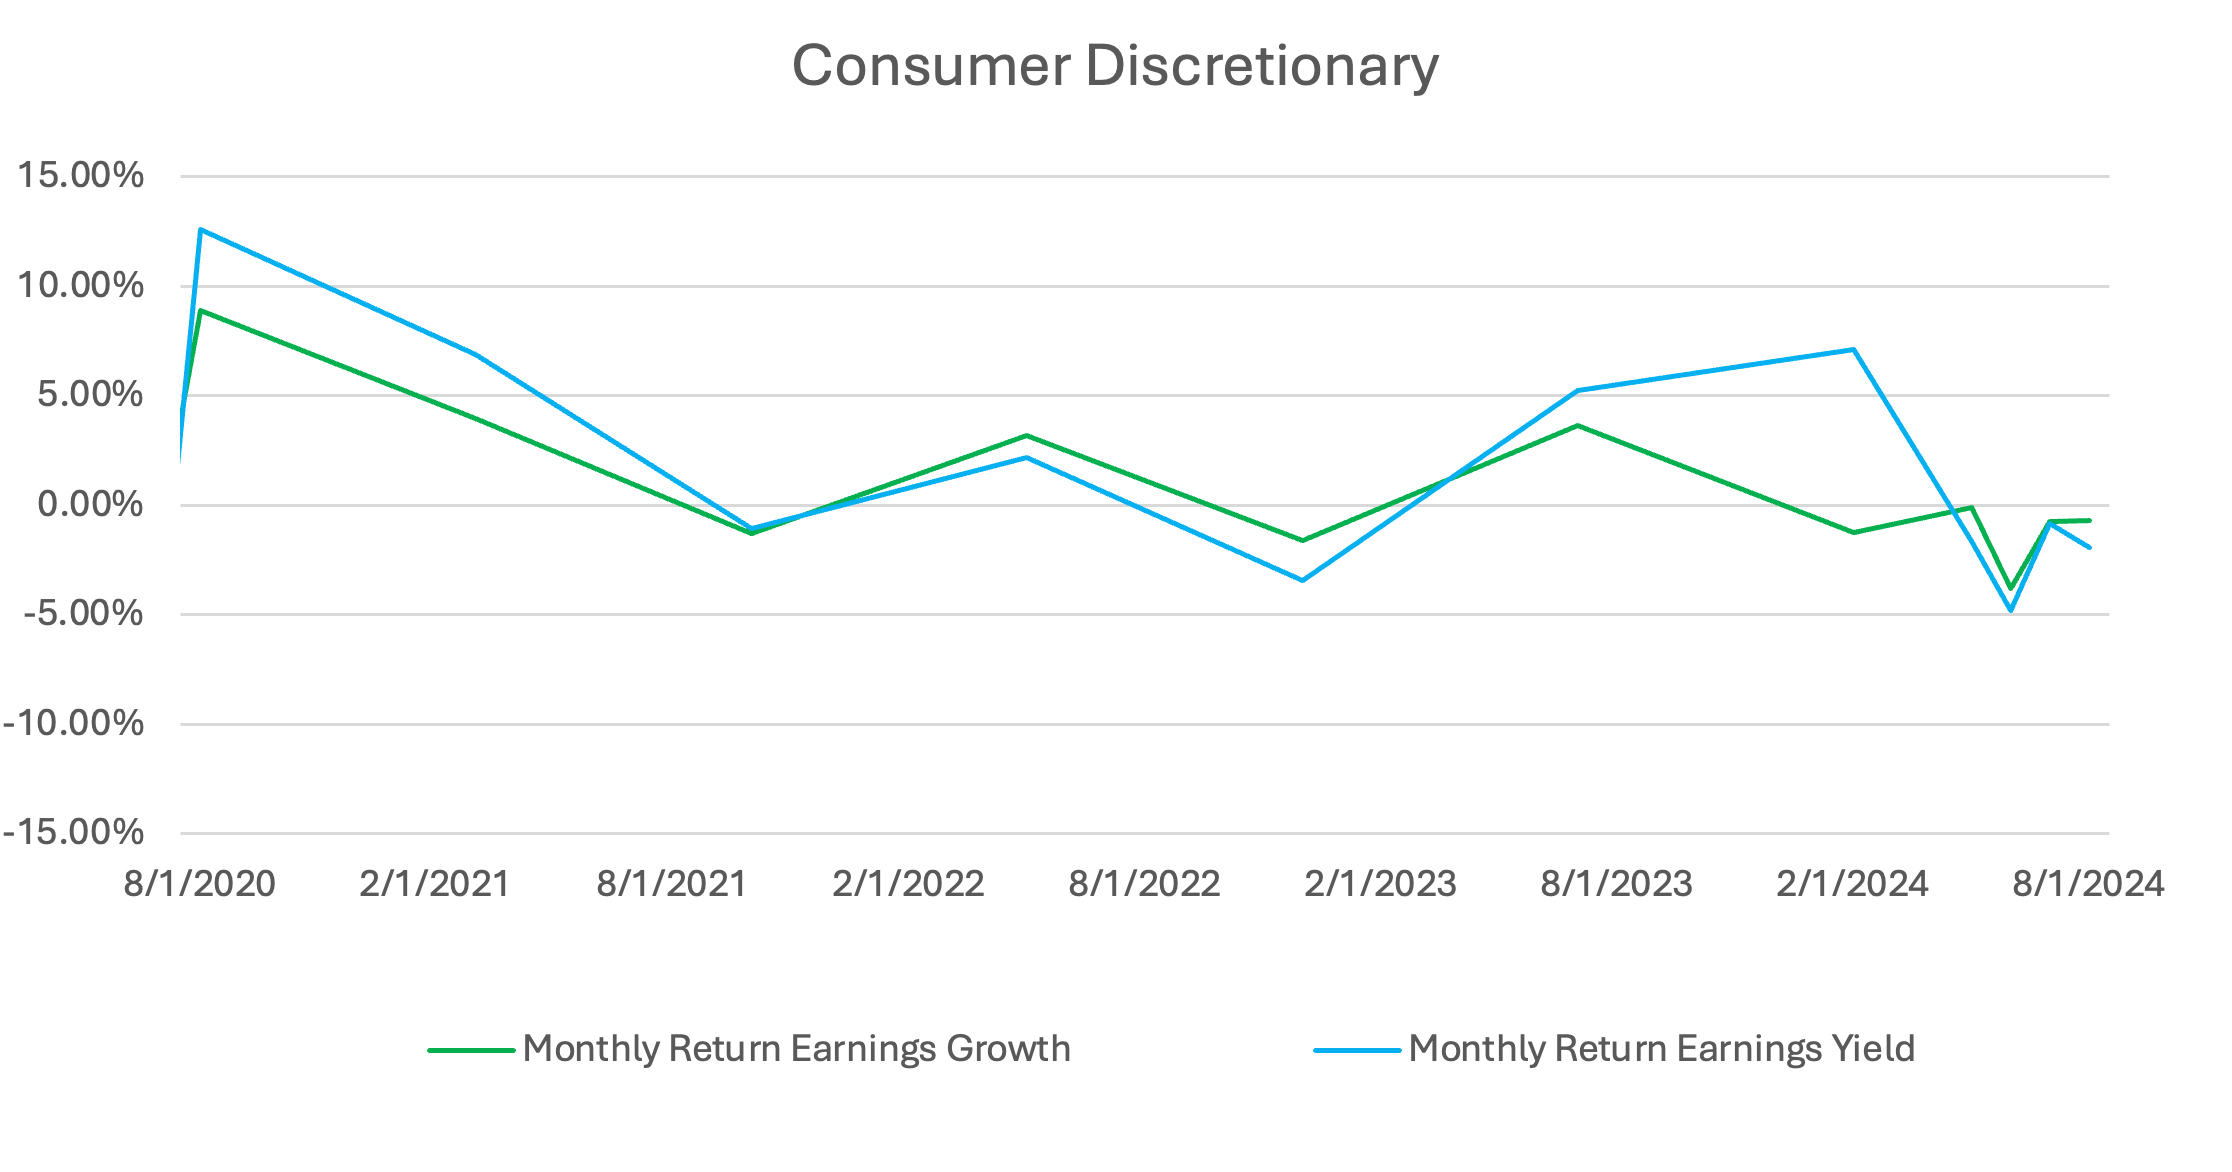
A contrasting trend emerged in the Japanese consumer discretionary sector, where high earnings yield securities led at the beginning of 2024. However, like the technology sector, this sector also experienced a correction in July following a decline in June. Investor pessimism is evident in this sector due to the low performance of high earnings growth securities since 2020, although there has been a recent improvement since July.
Source: Confluence Style Analytics
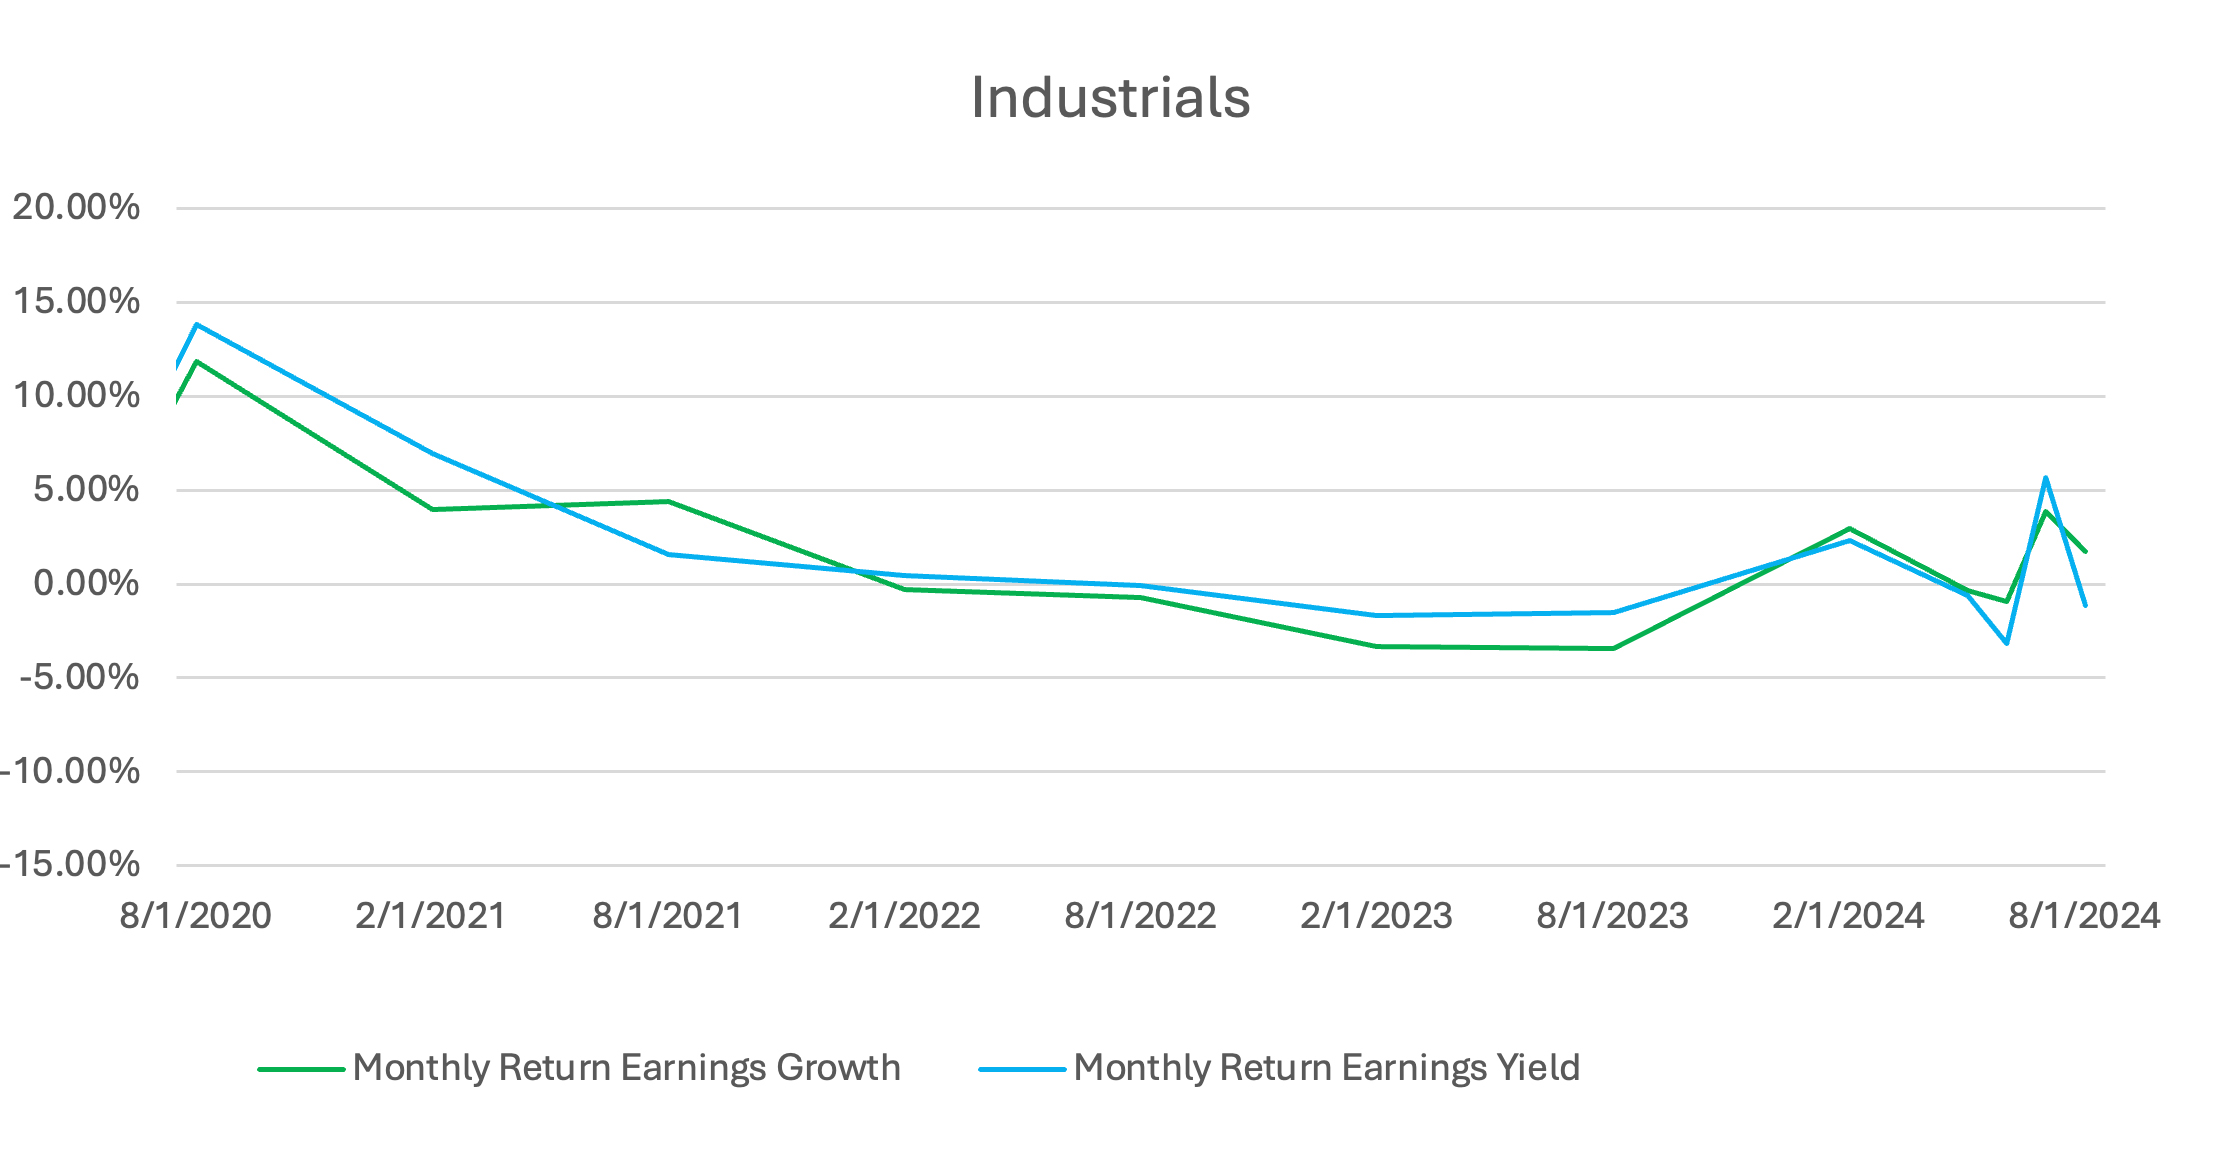
The Japanese manufacturing industry has a lasting impact on the global economy, known for its exceptional production standards and as the origin of several influential management and operational philosophies. Investors have viewed the industrials sector as relatively neutral in the past, characterized by consistent performance from both earnings growth and earnings yield securities. The rise in interest rates increases the cost of doing business, lowers capital expenditures and investments by companies, and diminishes consumer spending. Following the significant increase in both earnings yield and earnings growth performances in June, the interest rate changes announced in July resulted in a steeper decline for companies with stable earnings yield.
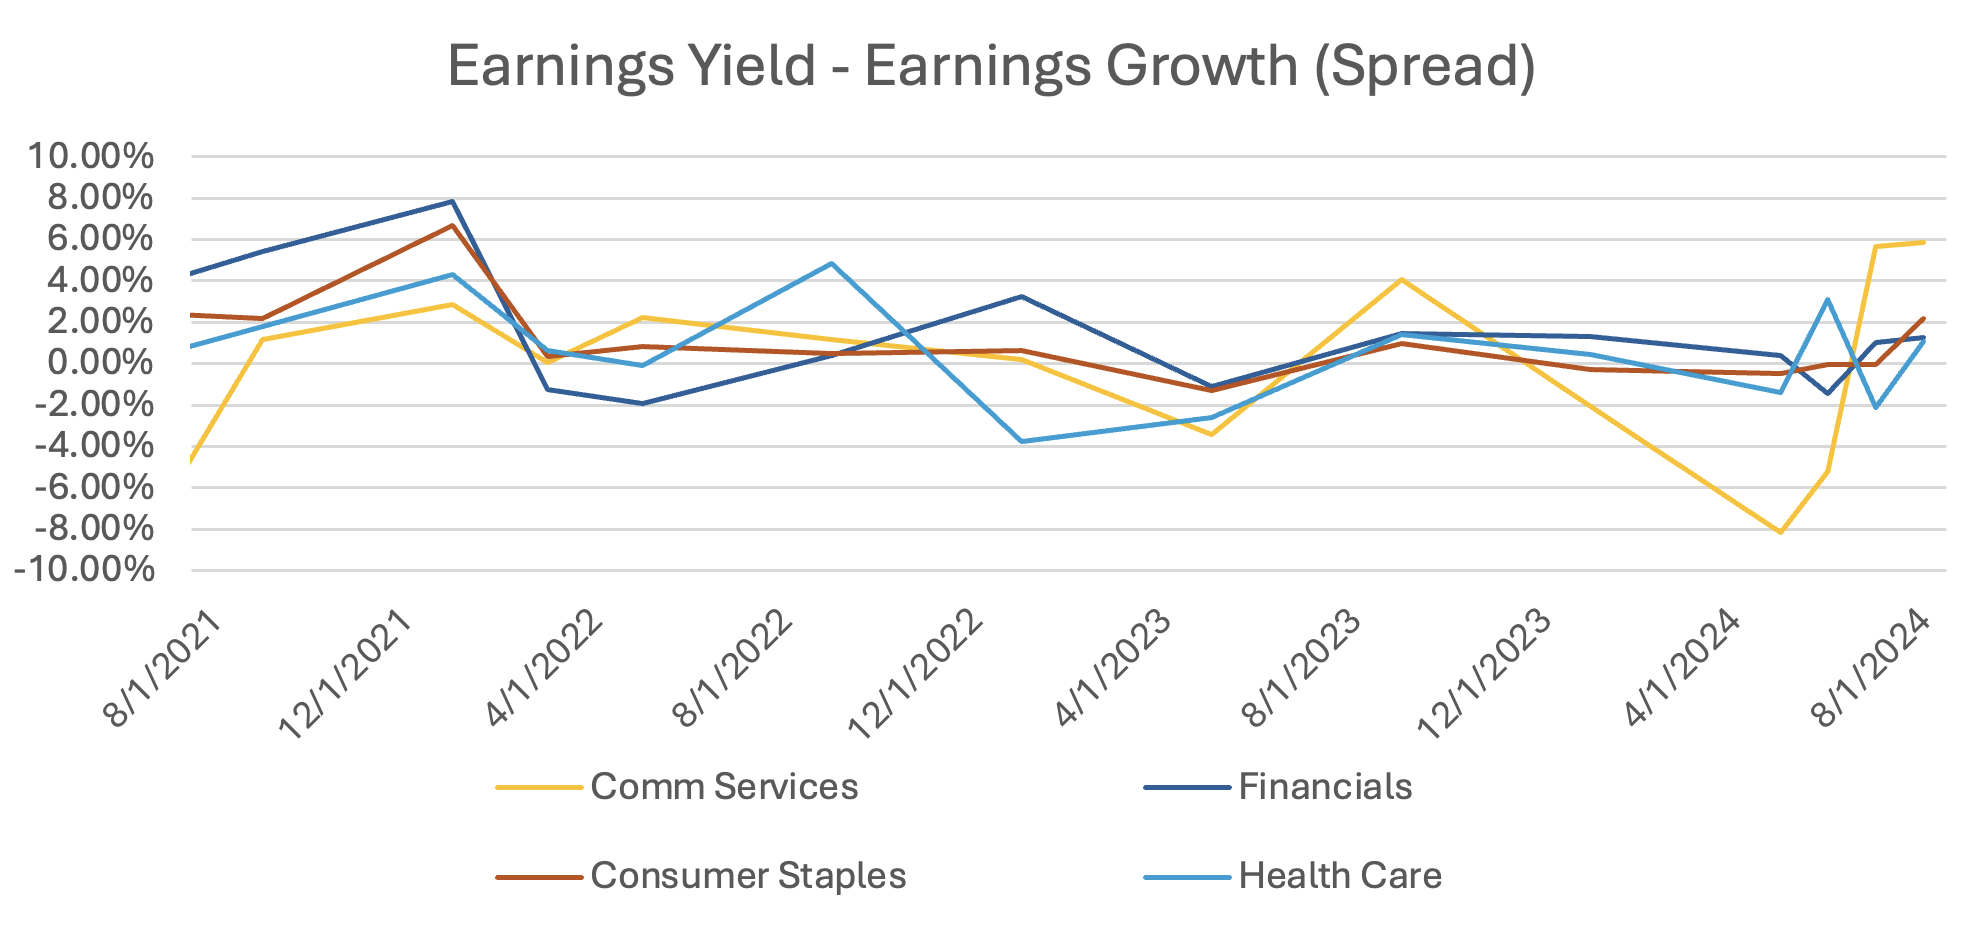
The chart below illustrates the Earnings Yield-Earnings Growth Spread for the remaining Japanese sectors:
Source: Confluence Style Analytics
Since the start of 2024, the communication services sector has undergone a significant shift in the Earnings Yield vs. Earnings Growth spread. Initially, the year favored the Value subfactor with a focus on earnings yield, but by mid-year, growth had taken the lead in driving performance, while the spread has been consistent for the remaining sectors.
“Inflation expectations of firms and households have risen moderately. The year-on-year rate of change in import prices has turned positive again, and upside risks to prices require attention.” BoJ Governor Kazuo Ueda informed reporters that the decision was made due to the relatively strong foundation of the Japanese economy, characterized by gradual price increases alongside wage growth, despite concerns regarding personal spending as prices rise. He also mentioned in a conference that “The policy rate is still very low even after a hike to 0.25%. It is still negative after inflation is taken into consideration.”
- BOJ’s Policy statement
Appendix: How to read the charts
Each factor’s performance is based on the relative performance of its top 50% of stocks by market cap, compared to the overall market. The Size factor uses the top 70% of stocks as the only exception.
For example, for the book-to-price factor, we determine the period’s performance of the basket of stocks with the highest book-to-price values relative to the total market. Each factor is analyzed independently, market and fundamental data are adjusted to enable sector-average (within each country) relative data to be used, and the performance measurement isolates the factor’s contribution to return.
Disclaimer
The information provided in this document is for informational purposes only and does not constitute legal, financial, accounting, compliance, or any other professional advice. Confluence makes no representations or warranties as to the accuracy, completeness, or suitability of this information for any purpose. Recipients of this document are solely responsible for ensuring their compliance with applicable laws and regulations. Confluence disclaims any liability for actions taken based on the information provided herein.
In this article:
- Exhibit 1: The chart illustrates the performance of top ten Japanese equity...
- Exhibit 2: 1Y Volatility of Japanese Equities
- Exhibit 3: Sector weighting of Nikkei index as of December 2023
- Exhibit 4: Comparing Earnings growth and Earnings yield for Japanese Info tech...
- Exhibit 5: Comparing Earnings growth and Earnings yield for Japanese Consumer...
- Exhibit 6: Comparing Earnings growth and Earnings yield for the Japanese Industrial...
- Exhibit 7: Earnings Yield and Growth...
About Confluence
Confluence is a leading global technology solutions provider committed to helping the investment management industry solve complex data challenges across the front, middle and back office. From data-driven portfolio analytics to compliance and regulatory solutions, including investment insights and research, Confluence invests in the latest technology to meet the evolving needs of asset managers, asset owners, asset services and asset allocators to provide best-of-breed solutions that deliver maximum scalability, speed and flexibility, while reducing risk and increasing efficiency. Headquartered in Pittsburgh, PA, with 900+ employees in 15 offices spanning across the United Kingdom, Europe, North America, South Africa, and Australia, Confluence services over 1000 clients in more than 40 countries. For more information, visit www.confluence.com
Confluence Media Contact:
Vanja Lakic
Cognito
[email protected]
+1 (917) 660-8527
